Go High-Performance Programming EP8: Optimizing GC in Golang Using go trace
Control memory manually through GOGC & GOMEMLIMIT


When developing with Golang, we typically don't focus too much on memory management since Golang's runtime efficiently handles garbage collection (GC). However, understanding GC can be significantly beneficial in performance optimization scenarios. This article explores optimizing GC and enhancing code performance using go trace through an example XML parsing service.
Special thanks to Arden Lions for their excellent presentation.
https://www.youtube.com/watch?v=PYMs-urosXs&t=23s If you're not familiar with `go trace`, check out @Vincent's [article on the trace package](https://medium.com/a-journey-with-go/go-discovery-of-the-trace-package-e5a821743c3c).All examples were run on my MacBook Pro M1, which has ten cores.
This article was first published in the Medium MPP plan. If you are a Medium user, please follow me on Medium. Thank you very much.
Our goal is to create a program that processes multiple RSS XML files and searches for items containing the keyword go in the title. We'll use the RSS XML file from my blog as an example and parse this file 100 times to simulate stress.
Complete code: GitHub Repository
Single-Threaded Approach
List 1: Counting Keywords with a Single Goroutine
func freq(docs []string) int {
    var count int
    for _, doc := range docs {
       f, err := os.OpenFile(doc, os.O_RDONLY, 0)
       if err != nil {
          return 0
       }
       data, err := io.ReadAll(f)
       if err != nil {
          return 0
       }
       var d document
       if err := xml.Unmarshal(data, &d); err != nil {
          log.Printf("Decoding Document [Ns] : ERROR :%+v", err)
          return 0
       }
       for _, item := range d.Channel.Items {
          if strings.Contains(strings.ToLower(item.Title), "go") {
             count++
          }
       }
    }
    return count
}

func main() {
    trace.Start(os.Stdout)
    defer trace.Stop()
    files := make([]string, 0)
    for i := 0; i < 100; i++ {
       files = append(files, "index.xml")
    }
    count := freq(files)
    log.Println(fmt.Sprintf("find key word go %d count", count))
}
The code is straightforward; we use a for loop to complete the task and then execute it:
➜  go_trace git:(main) ✗ go build
➜  go_trace git:(main) ✗ time ./go_trace 2 > trace_single.out

-- result --
2024/08/02 16:17:06 find key word go 2400 count
./go_trace 2 > trace_single.out  1.99s user 0.05s system 102% cpu 1.996 total
Then, we use go trace to view trace_single.out.
- RunTime: 2031ms
- STW (Stop-the-World): 57ms
- GC Occurrences: 252ms
- GC STW AVE: 0.227ms
GC time accounts for approximately 57 / 2031 ≈ 0.02 of the total runtime. The maximum memory usage is around 11.28MB.
Figure 1: Single Thread - Run Time

Figure 2: Single Thread - GC

Figure 3: Single Thread - Max Heap
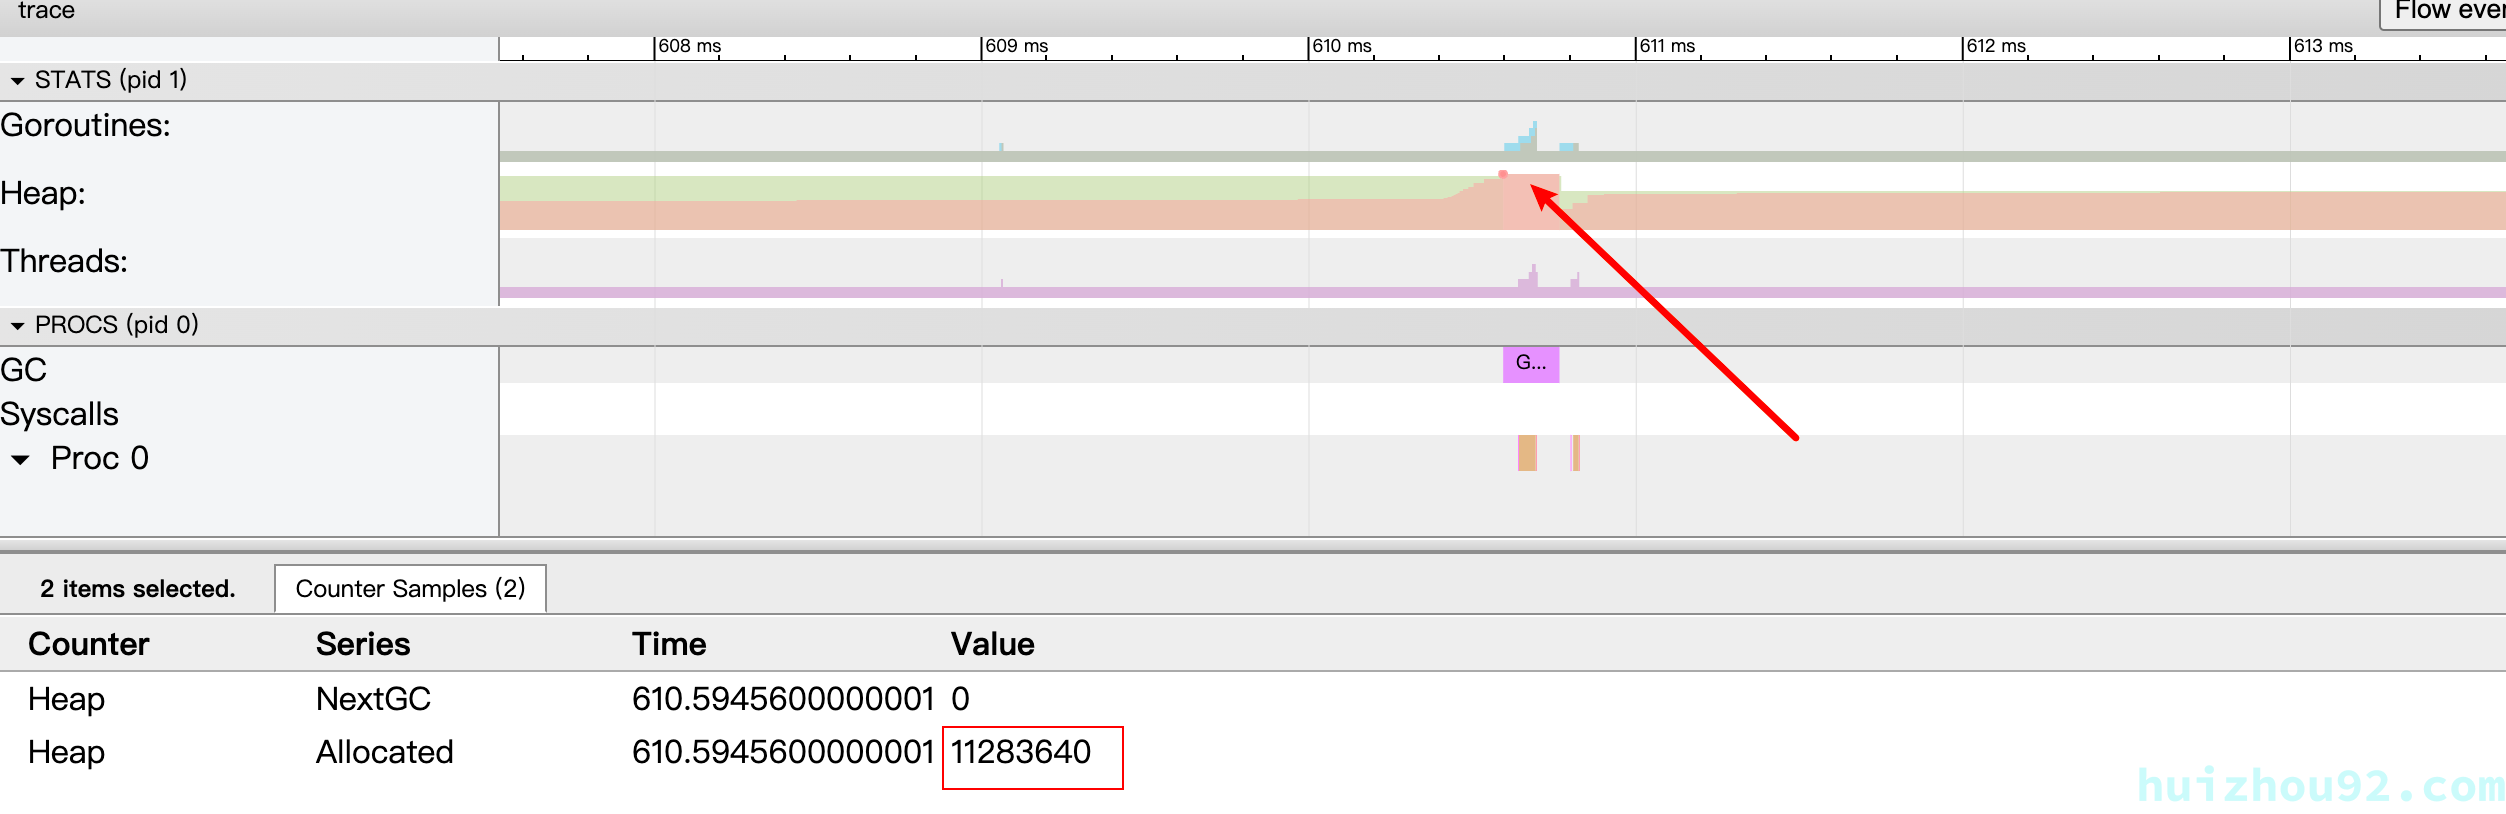
Currently, we are using only one core, resulting in low resource utilization. To speed up the program, it's better to use concurrency, which is where Golang excels.
Concurrent Approach
List 2: Counting Keywords Using FinOut
func concurrent(docs []string) int {
    var count int32
    g := runtime.GOMAXPROCS(0)
    wg := sync.WaitGroup{}
    wg.Add(g)
    ch := make(chan string, 100)
    go func() {
       for _, v := range docs {
          ch <- v
       }
       close(ch)
    }()

    for i := 0; i < g; i++ {
       go func() {
          var iFound int32
          defer func() {
             atomic.AddInt32(&count, iFound)
             wg.Done()
          }()
          for doc := range ch {
             f, err := os.OpenFile(doc, os.O_RDONLY, 0)
             if err != nil {
                return
             }
             data, err := io.ReadAll(f)
             if err != nil {
                return
             }
             var d document
             if err = xml.Unmarshal(data, &d); err != nil {
                log.Printf("Decoding Document [Ns] : ERROR :%+v", err)
                return
             }
             for _, item := range d.Channel.Items {
                if strings.Contains(strings.ToLower(item.Title), "go") {
                   iFound++
                }
             }
          }
       }()
    }

    wg.Wait()
    return int(count)
}
Run the program using the same method:
go build
time ./go_trace 2 > trace_pool.out
---
2024/08/02 19:27:13 find key word go 2400 count
./go_trace 2 > trace_pool.out  2.83s user 0.13s system 673% cpu 0.439 total
- RunTime: 425ms
- STW: 154ms
- GC Occurrences: 39
- GC STW AVE: 3.9ms
GC time accounts for approximately 154 / 425 ≈ 0.36 of the total runtime. The maximum memory usage is 91.60MB.
Figure 4: Concurrent - GC Count
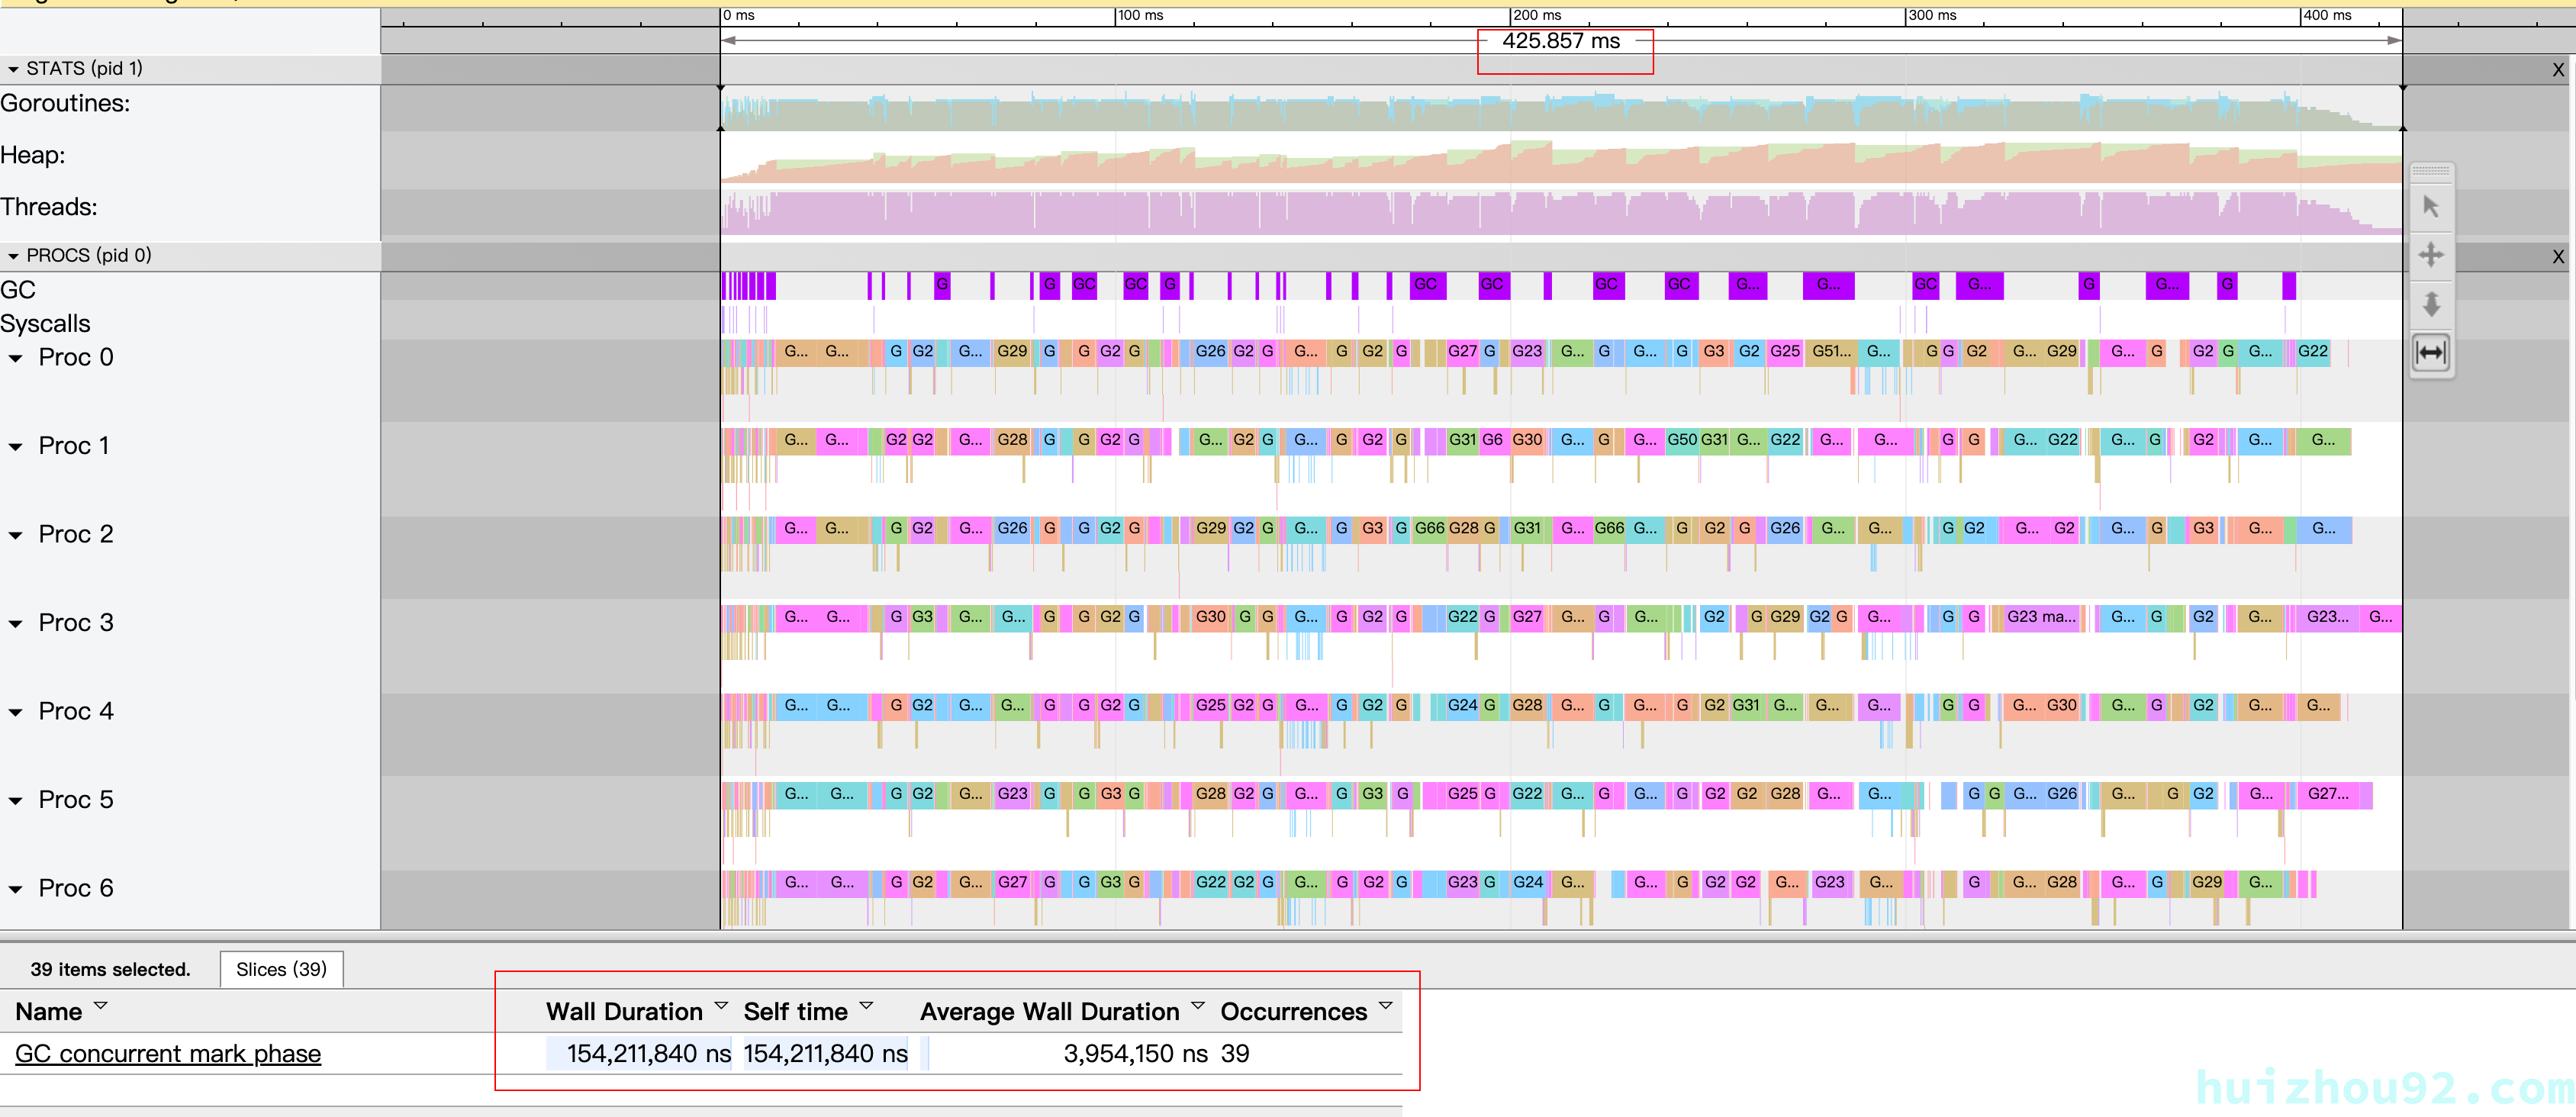
Figure 5: Concurrent - Max Heap

The concurrent version is about five times faster than the single-threaded version. In the go trace results, we can see that GC occupies 36% of the runtime in the concurrent version. Is there a way to optimize this time? Fortunately, in Go 1.19, we have two parameters to control GC.
GOGC & GOMEMLIMIT
In Go 1.19, two parameters were added to control GC. GOGC controls the frequency of garbage collection, while GOMEMLIMIT limits the maximum memory usage of a program. For detailed information on GOGC and GOMEMLIMIT, refer to the official documentation gc-guide.
GOGC
According to the official documentation, the formula is as follows:
$New heap memory = (Live heap + GC roots) * GOGC / 100$
Theoretically, if we set GOGC to 1000, it will reduce the frequency of GC by ten times at the cost of increasing memory usage tenfold (this is a theoretical model, and reality is more complex). Let's give it a try.
➜  go_trace git:(main) ✗ time GOGC=1000 ./go_trace 2 > trace_gogc_1000.out
2024/08/05 16:57:29 find key word go 2400 count
GOGC=1000 ./go_trace 2 > trace_gogc_1000.out  2.46s user 0.16s system 757% cpu 0.346 total
- RunTime: 314ms
- STW: 9.572ms
- GC Occurrences: 5
- GC STW AVE: 1.194ms
GC time accounts for approximately 9.572 / 314 ≈ 0.02 of the total runtime. The maximum memory usage is 451MB.
Figure 6: GOGC - Max Heap
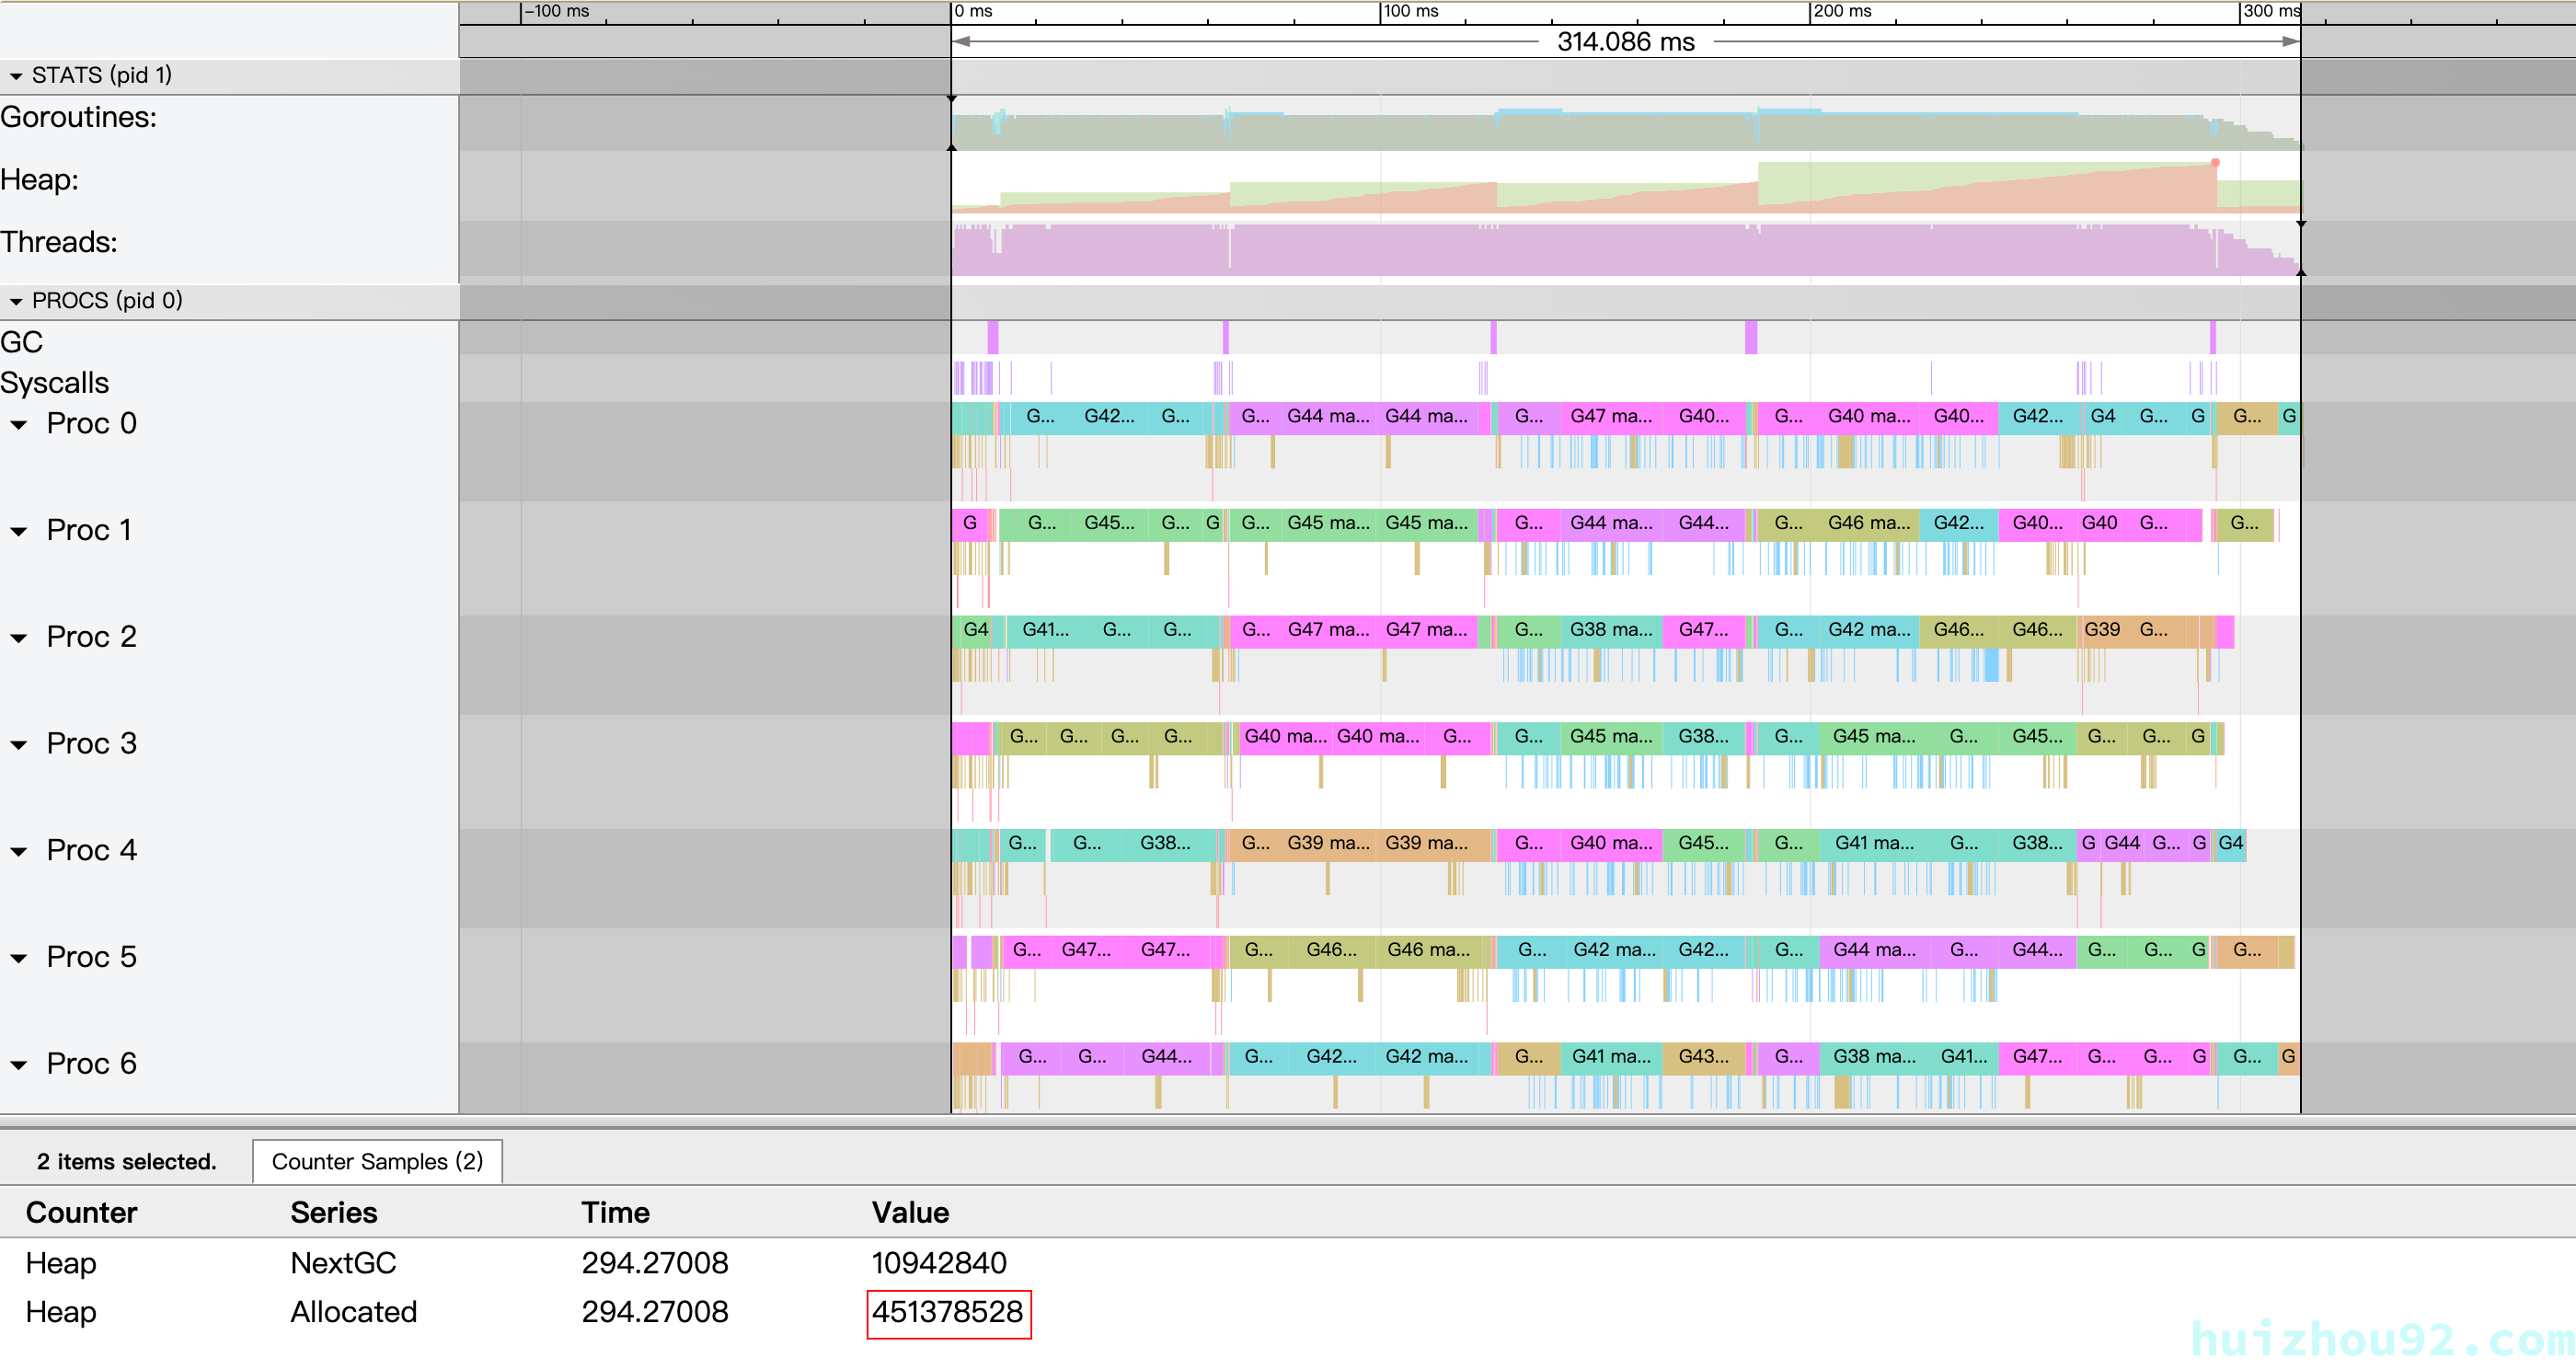
Figure 7: GOGC - GC Count

GOMEMLIMIT
GOMEMLIMIT is used to set a program's memory usage limit. It is typically used when automatic GC is disabled, allowing us to manage the total memory usage manually. When the allocated memory reaches the limit, GC will be triggered. Note that even though GC works hard, the memory usage may still exceed the GOMEMLIMIT.
Our program uses 11.28MB of memory in the single-threaded version. In the concurrent version, ten goroutines run simultaneously. According to the gc-guide, we need to reserve 10% of the memory for emergencies. Therefore, we can set GOMEMLIMIT to 11.28MB * 1.1 ≈ 124MB.
➜  go_trace git:(main) ✗ time GOGC=off GOMEMLIMIT=124MiB ./go_trace 2 > trace_mem_limit.out
2024/08/05 18:10:55 find key word go 2400 count
GOGC=off GOMEMLIMIT=124MiB ./go_trace 2 > trace_mem_limit.out  2.83s user 0.15s system 766% cpu 0.389 total
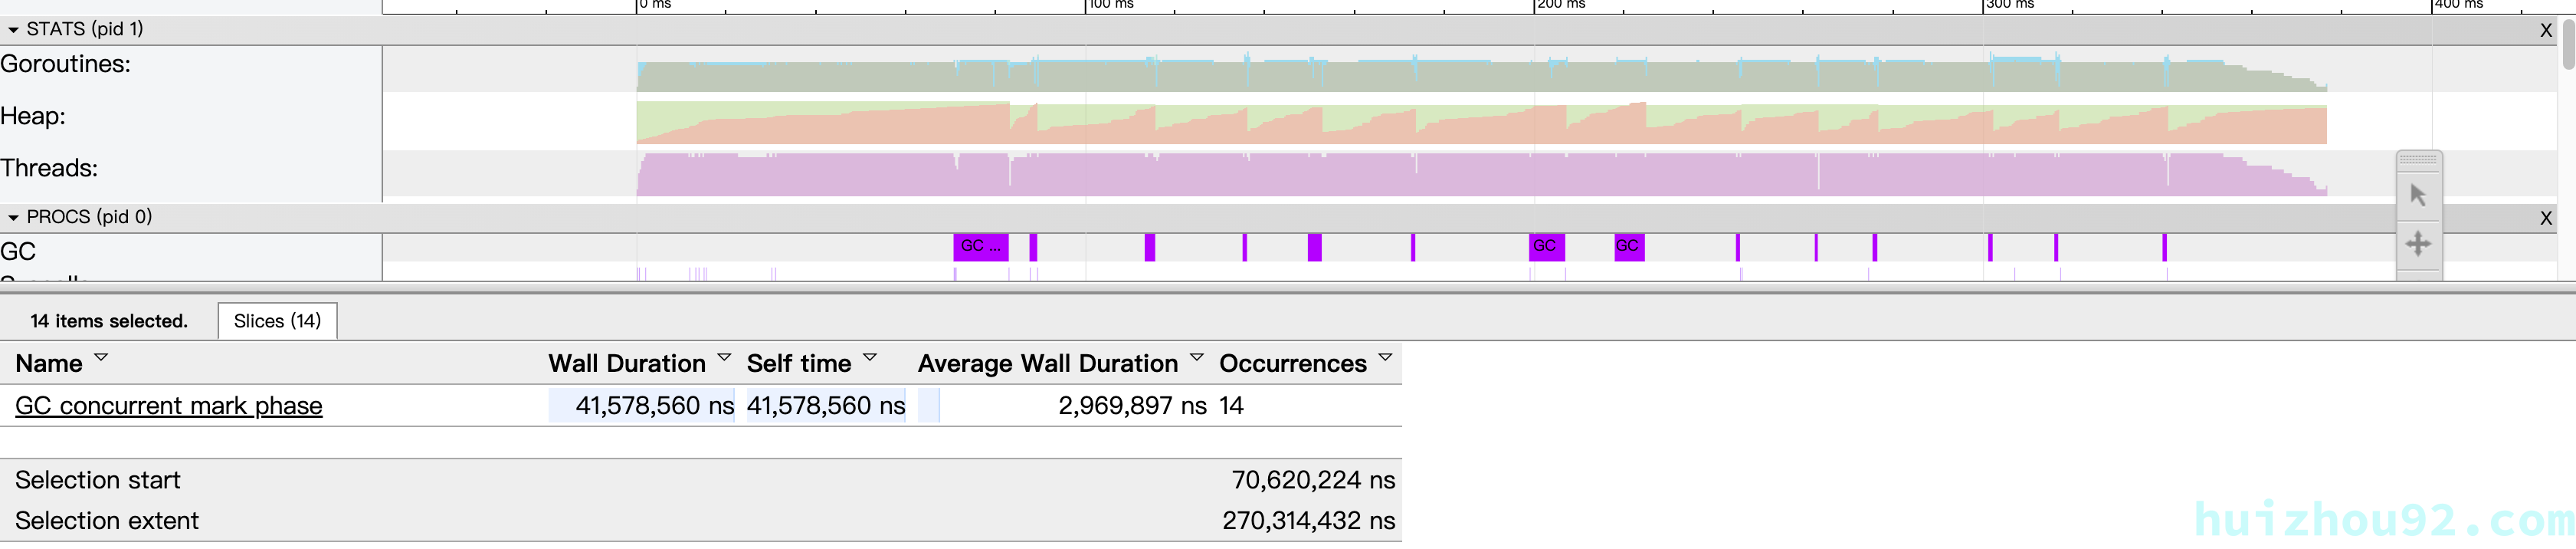
- RunTime: 376.455ms
- STW: 41.578ms
- GC Occurrences: 14
- GC STW AVE: 2.969ms
GC time accounts for approximately 41.578 / 376.455 ≈ 0.11 of the total runtime. The maximum memory usage is 120MB, close to our set limit.
Figure 8: GOMEMLIMIT - GC Max Heap

Figure 9: GOMEMLIMIT - GC Count
As shown in the trace below, increasing the GOMEMLIMIT parameter can yield better results, such as with GOMEMLIMIT=248MiB.
Figure 10: GOMEMLIMIT=248MiB - GC
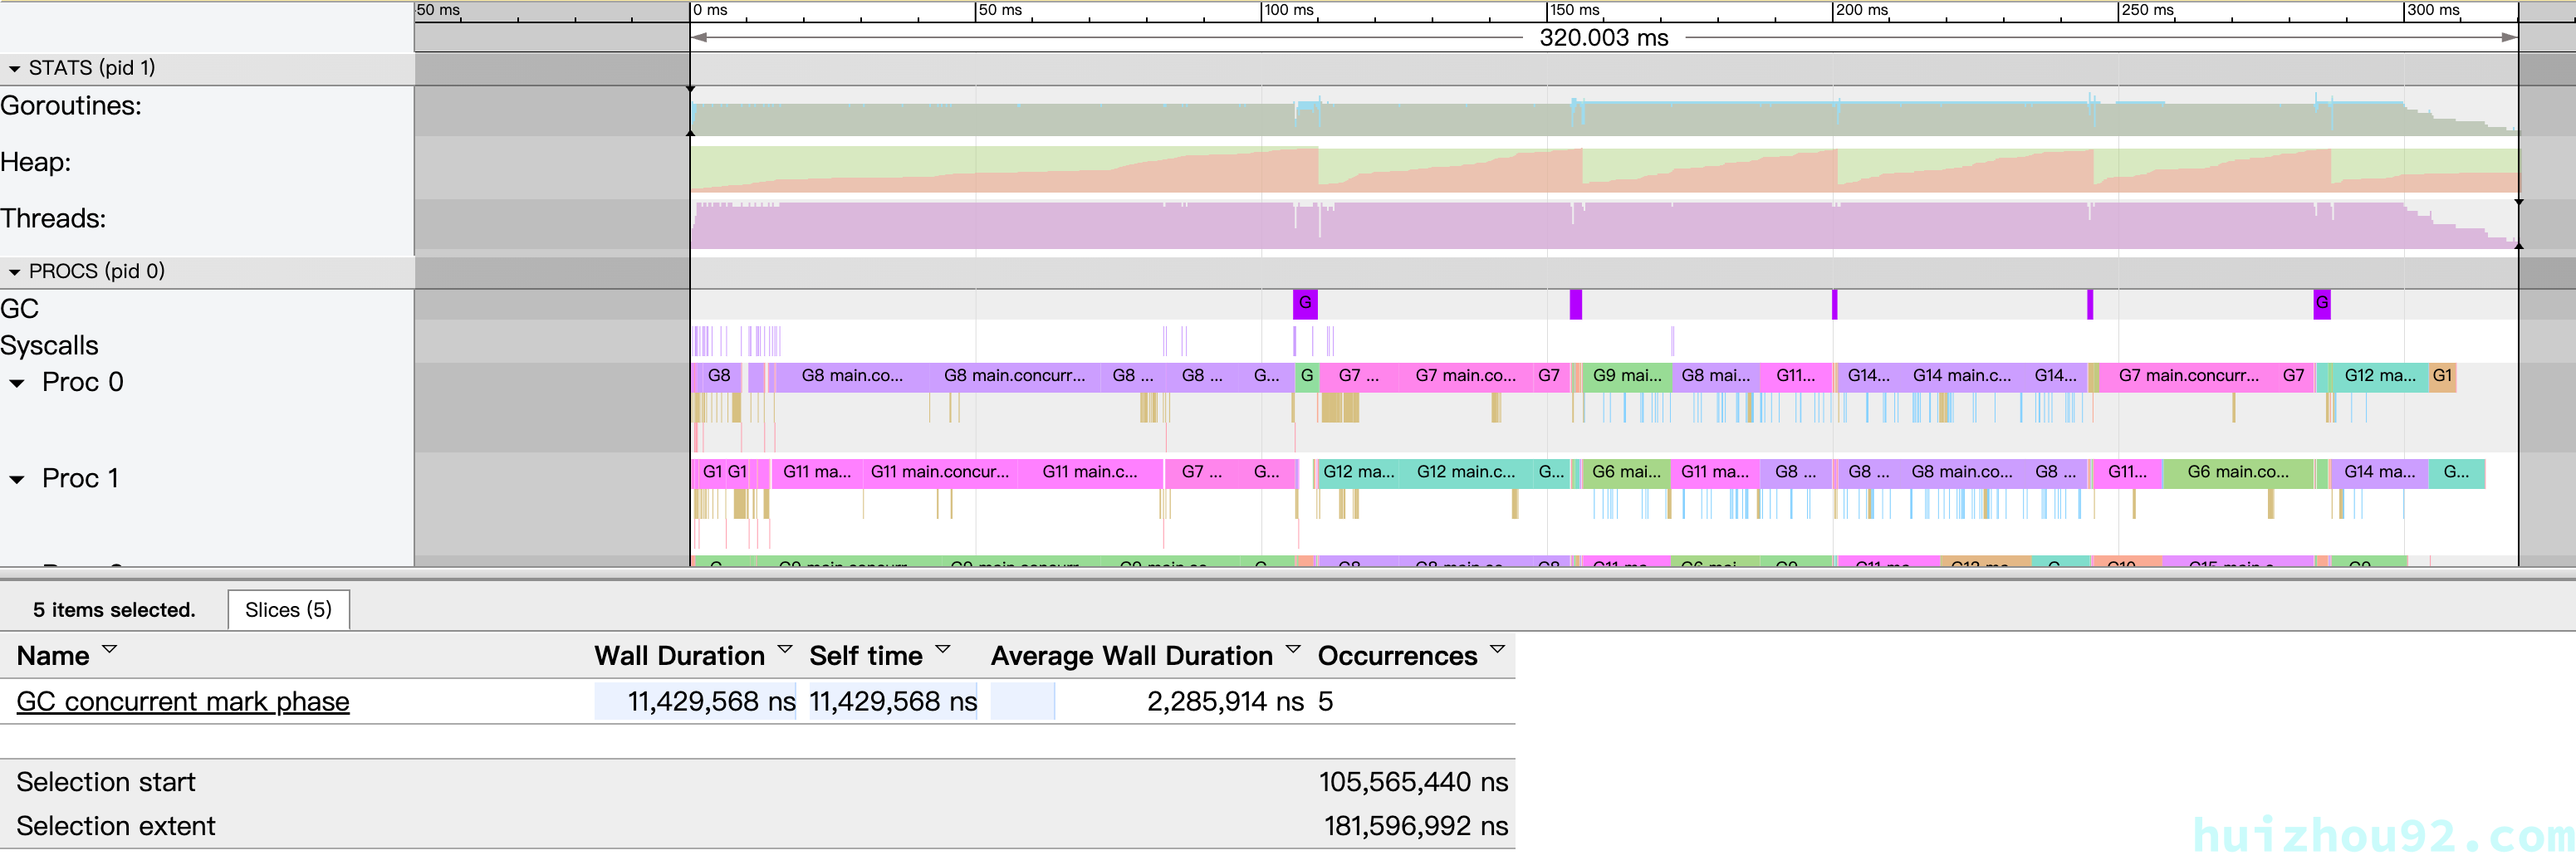
- RunTime: 320.455ms
- STW: 11.429ms
- GC Occurrences: 5
- GC STW AVE: 2.285ms
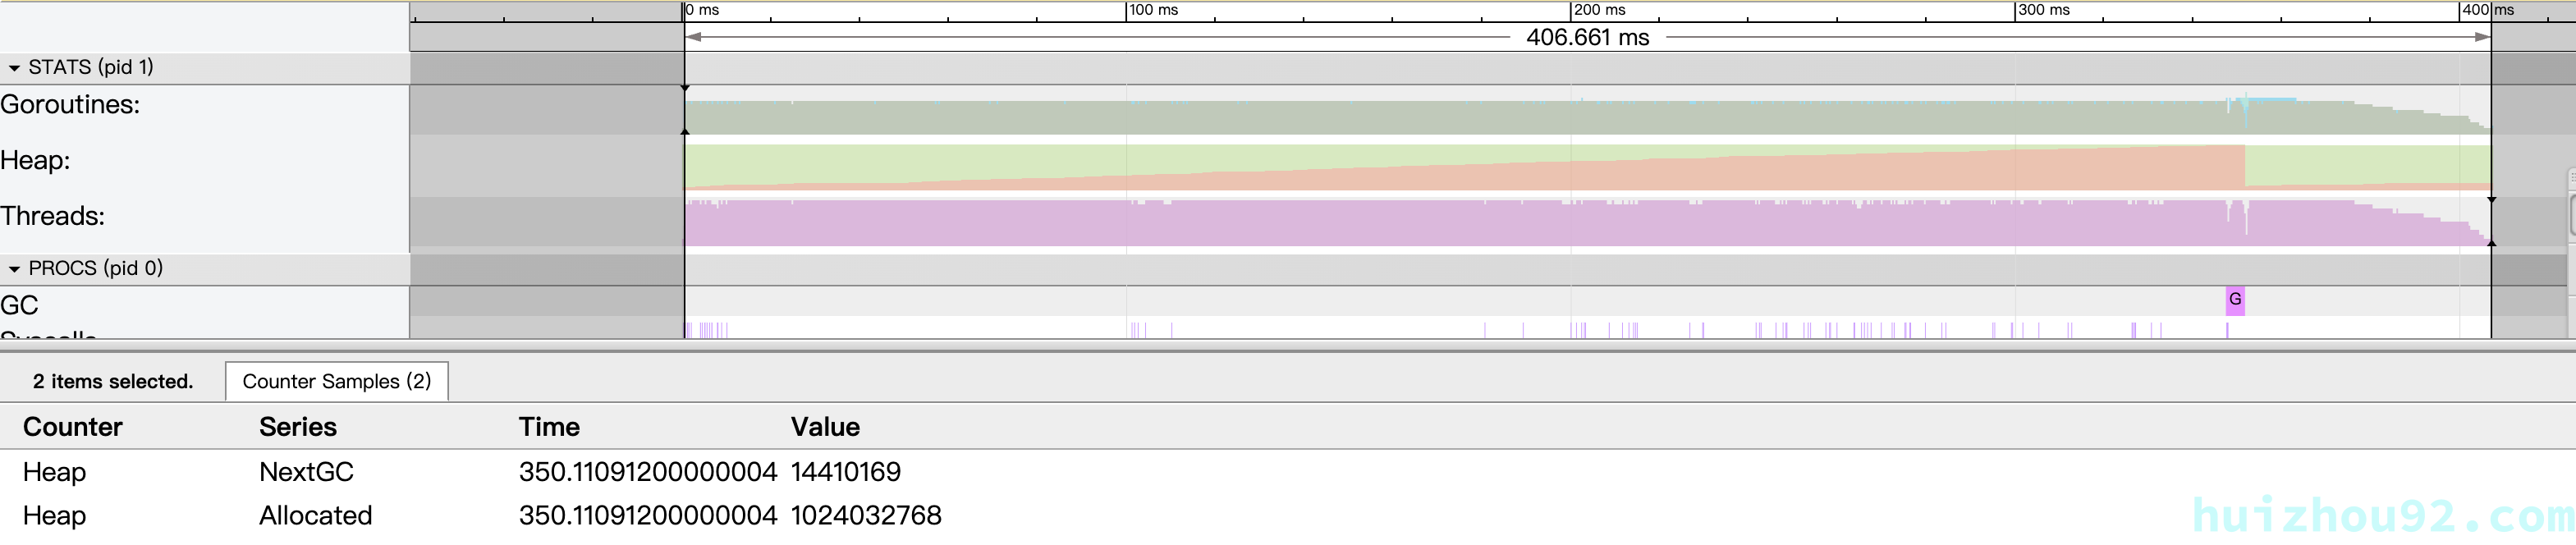
However, it is not without limits. For instance, with GOMEMLIMIT=1024MiB, RunTime has already reached 406ms.
Figure 11: GOMEMLIMIT=1024MiB - GC
Risks
The Suggested Uses section of the official documentation provides clear recommendations. Do not use these two parameters unless you are very familiar with your program's runtime environment and workload. Be sure to read the gc-guide.
Conclusion
Let's summarize the optimization process and results:
Figure 12: Result Comparison

Using GOGC and GOMEMLIMIT in suitable scenarios can effectively improve performance. It provides a sense of control over an uncertain aspect. However, it must be applied judiciously in controlled environments to ensure performance and reliability. Use caution in resource-sharing or uncontrolled environments to avoid performance degradation or program crashes due to improper settings.